
Why Your Website Feels Fast but PageSpeed Insights Says It’s Slow?
You open your website on your phone and it loads right away. No waiting, no jumping around, everything feels smooth. But then you check your score on PageSpeed Insights and it shows something like 50.
That feels confusing, but here’s what’s really going on.
Your phone is loading the site in normal conditions. Good connection, maybe some data already saved, and a decent device. So of course it feels fast.
PageSpeed Insights does the opposite. It tests your site in a tougher situation. Think slower internet, an average phone, and someone visiting for the very first time. Nothing is saved, everything has to load from scratch.
So the score isn’t showing how your site feels to you. It’s showing how it performs when things aren’t ideal.
Also, that 0 to 100 number isn’t what Google mainly looks at when deciding rankings.
What really matters is how real people experience your site over time. If your pages load quickly for most visitors and feel smooth to use, that’s what counts.
Once you get that, the focus changes. Instead of chasing a perfect score, you start focusing on making your site reliably fast and easy for actual users.
Why Your Site Feels Fast but the Score Says Slow
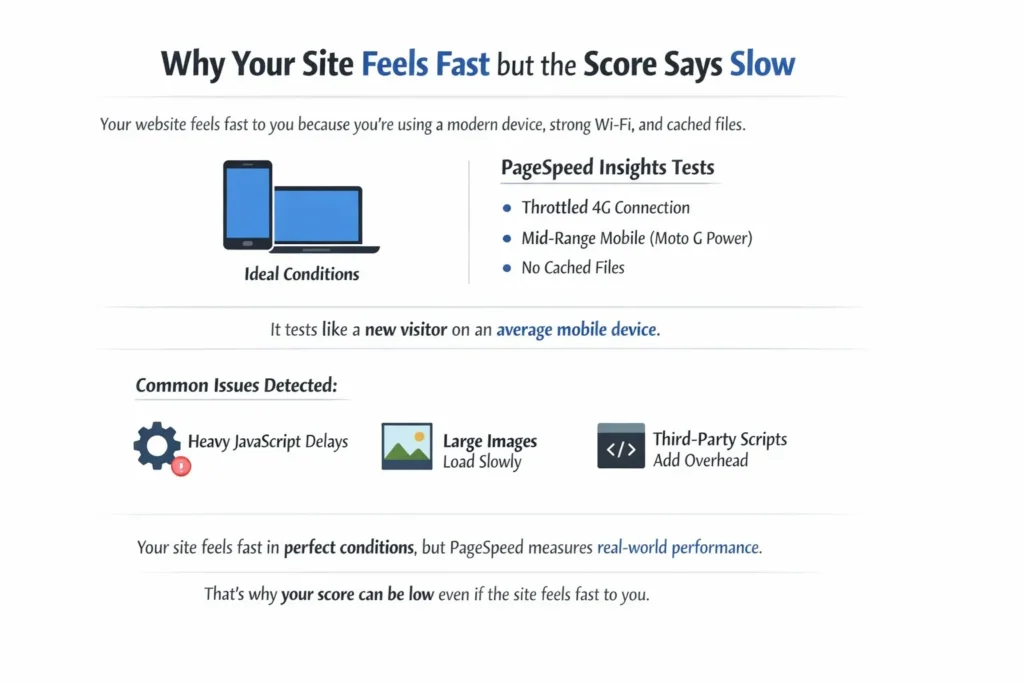
Your website may feel fast when you test it, but that experience usually happens under ideal conditions. You’re likely using a modern phone or laptop, a strong Wi-Fi connection, and a browser that has already cached many of your site’s files.
That makes everything feel quick and smooth.
But PageSpeed Insights doesn’t test your site in that environment.
Instead, it simulates a first-time visitor using:
- A throttled 4G-like connection
- A mid-range mobile device, based on the Moto G Power
- A fresh browser session with no cached files
That means every image, script, and stylesheet has to load from scratch, just like it would for a new visitor on an average mobile device.
Under those conditions, common issues become easier to detect:
- Heavy JavaScript can delay interactions
- Large images can slow visible loading
- Third-party scripts can add noticeable overhead
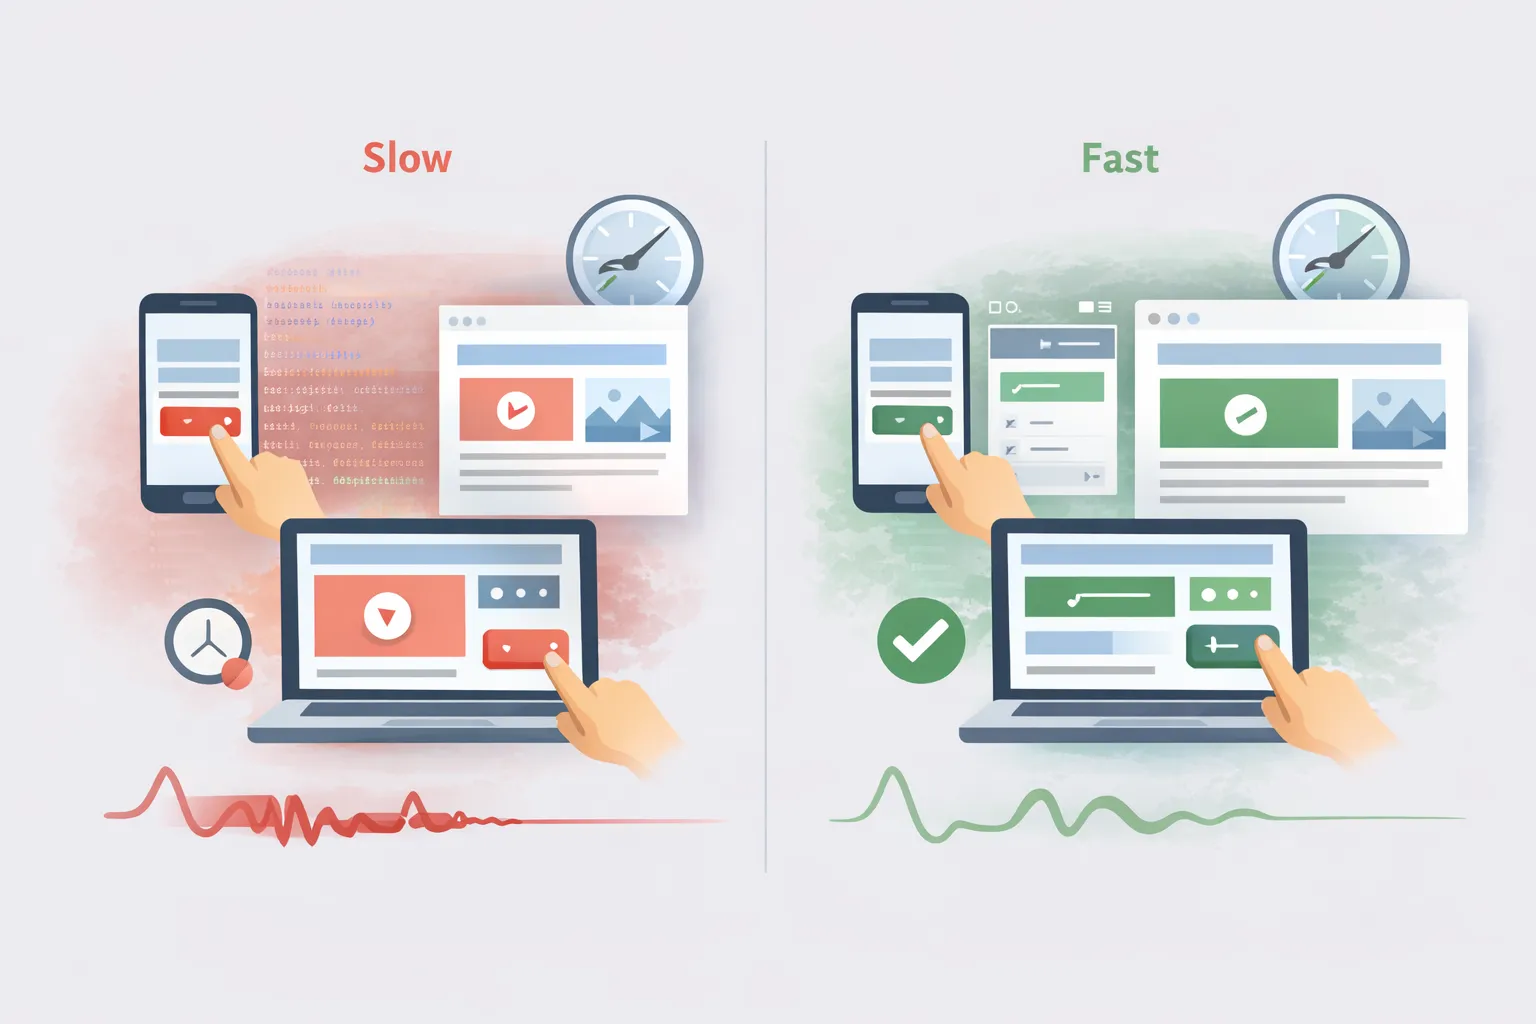
So the difference is simple: your site feels fast in ideal conditions, while PageSpeed measures how it performs in average conditions.
That’s why a website that feels smooth to you can still get a low score. The score isn’t measuring your personal experience—it’s measuring how well your site performs when conditions are less forgiving.
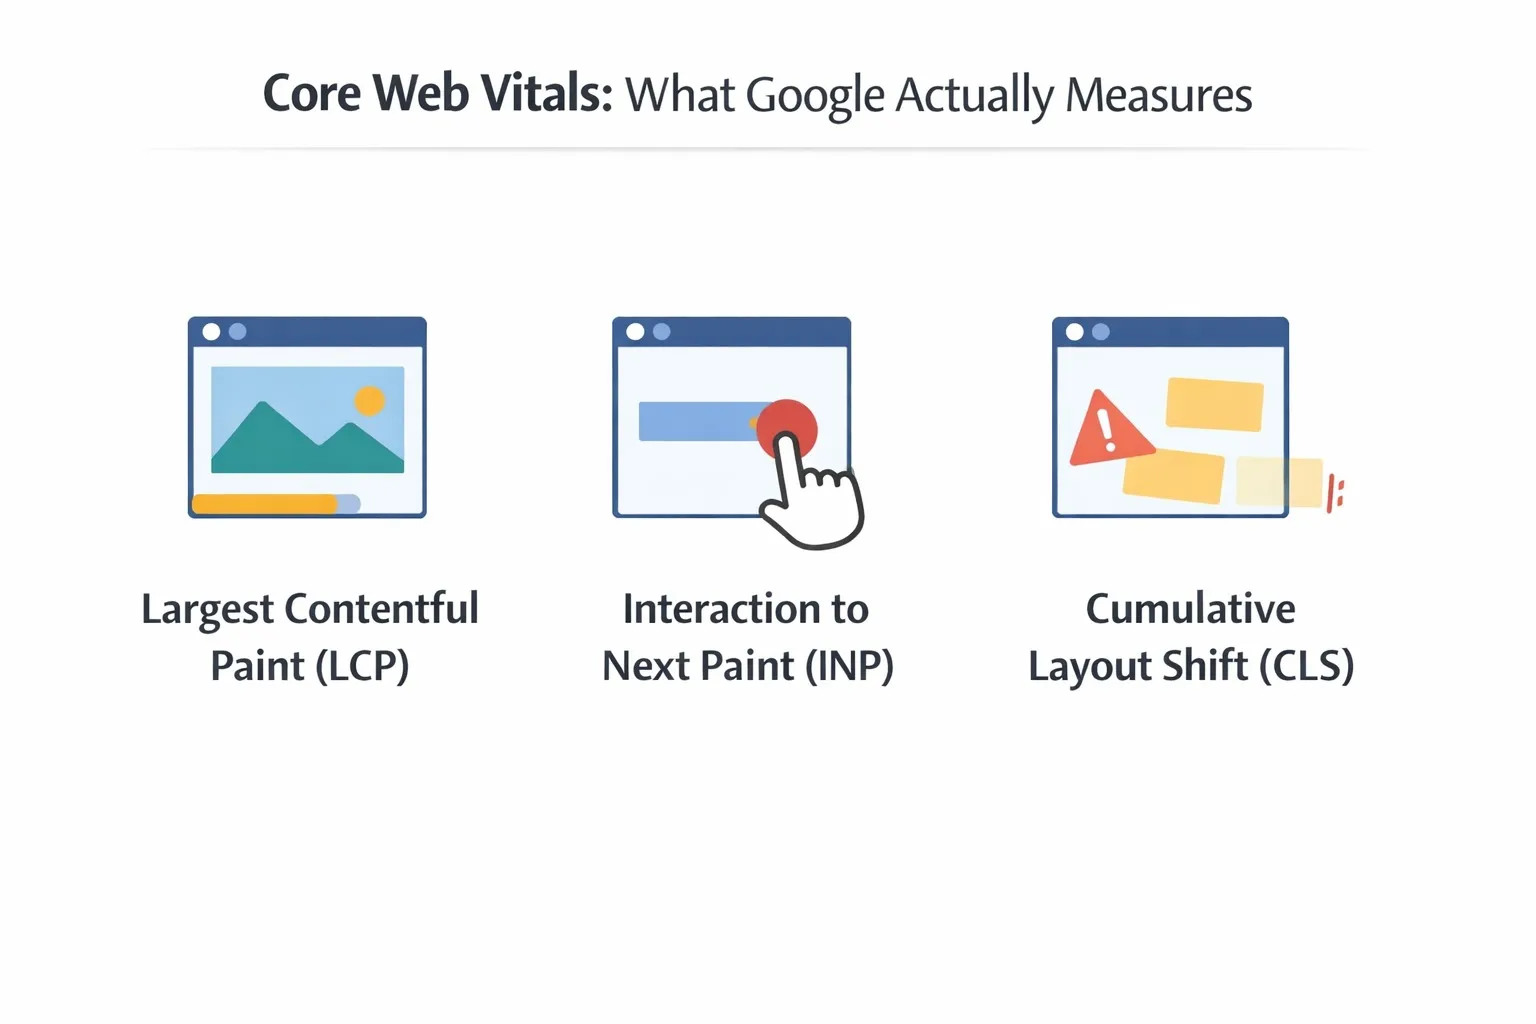
Core Web Vitals: What Google Actually Measures
While the PageSpeed score gets most of the attention, it is not what directly influences rankings.
Google relies on a smaller, more focused set of metrics that reflect how real users experience your site over time. This data comes from the Chrome User Experience Report (CrUX), which aggregates anonymised performance data from actual Chrome users across different devices, networks, and regions.
Instead of giving you a fluctuating score, this system evaluates your site using a pass/fail approach based on three key metrics.
The three that matter:
- Largest Contentful Paint (LCP) — Loading experience
- Measures how long it takes for the main content (often a hero image or primary heading) to become visible
- Target: under 2.5 seconds
- This is essentially the moment users feel the page has “arrived”
- Interaction to Next Paint (INP) — Responsiveness
- Measures how quickly the page responds to user interactions across the entire session
- Target: under 200 milliseconds
- This includes clicks, taps, typing—everything that requires feedback
- Cumulative Layout Shift (CLS) — Visual stability
- Measures how much elements move around unexpectedly during loading
- Target: less than 0.1
- Layout shifts are subtle but frustrating, especially when they interfere with clicks
These three metrics combine into a simple outcome:
- You either pass, meaning your site is “good enough” for user experience,
- Or you fail, meaning improvements are needed
That simplicity is intentional. Google isn’t rewarding perfection—it’s checking whether your site meets a baseline of usability.
Quick Breakdown: What Matters vs What Looks Important
| Feature | The 0–100 Score | Core Web Vitals (Real Users) |
| Visible as | A large number at the top | A “Passed” or “Failed” status |
| Source | Controlled simulation | Real usage data from CrUX |
| SEO impact | Primarily diagnostic | Direct ranking signal |
| Stability | Can fluctuate on every test | Based on a 28-day rolling average |
Another small but important detail you might notice in PageSpeed Insights is the difference between:
- “This URL” data
- “Origin Summary” data
If a specific page doesn’t have enough traffic, Google falls back to the origin summary, which represents the average performance of your entire website.
This has a real implication:
- A brand-new page might not have its own performance data yet
- In that case, Google evaluates it based on your site-wide performance
So if the rest of your site is slow, even your new pages can inherit that reputation. Site-wide health matters more than many people realise.
Why “Slow” Sites Still Win
At some point, everyone notices a competitor ranking above them despite having worse performance scores.
It raises a natural question: if speed matters, why does this happen?
The answer is straightforward once you step back and look at how ranking actually works.
Google prioritises:
- Search intent – does the page truly answer the user’s query?
- Content quality – is the information deep, accurate, and useful?
- Authority and trust – do other reputable sites link to it?
Only after those factors are comparable then performance come into play.
You can think of speed as a tie-breaker rather than a primary driver.
If two pages are equally strong in terms of content and authority, the one that offers a smoother experience will likely rank higher. But if one page is clearly more useful, it can outperform a faster competitor without issue.
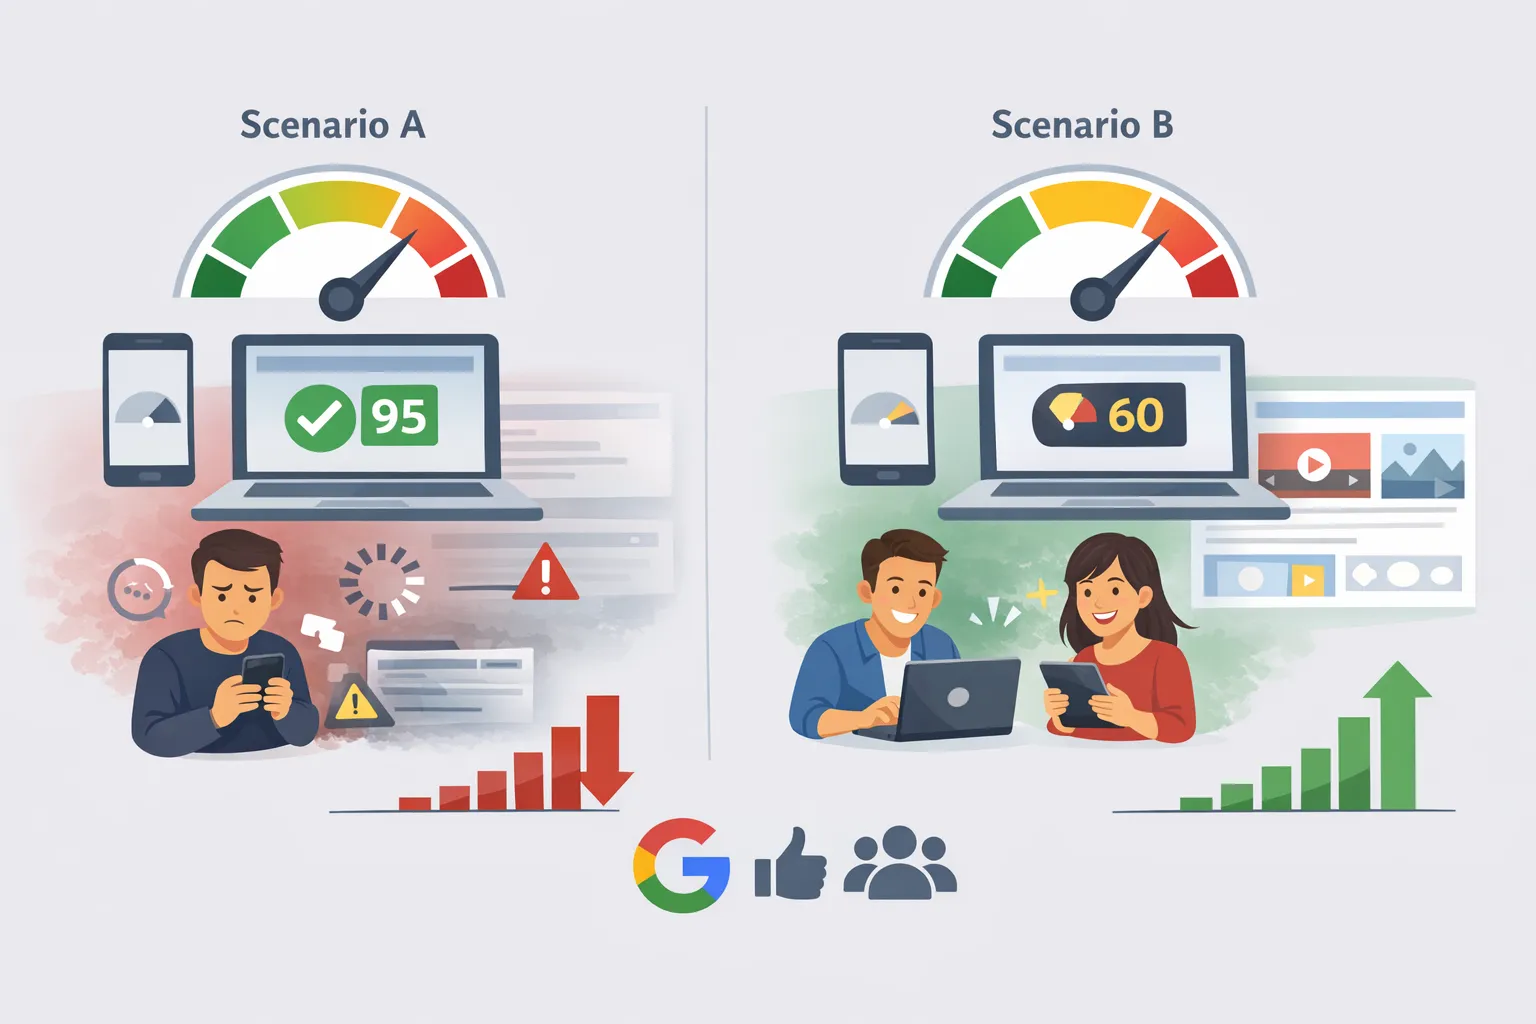
The Pass/Fail Paradox: Two Scenarios That Confuse Everyone
This is where things become counterintuitive.
Scenario A: High Score, Poor Real Experience
- PageSpeed score is high (90+)
- But real users experience delays or instability
This can happen when:
- The controlled test environment doesn’t trigger real-world interaction issues
- Certain edge cases only appear during actual usage
Outcome: Rankings may suffer because real users are not having a smooth experience.
Scenario B: Low Score, Strong Real Experience
- PageSpeed score is moderate or low (50–70)
- But users interact smoothly and stay engaged
This often happens when:
- The page includes heavier features (videos, rich visuals, interactive elements)
- But those features are implemented in a way that doesn’t hurt usability
Outcome: Rankings remain stable because users are satisfied.
The takeaway here is simple:
Google prioritises what people actually experience over what a controlled test predicts.
The Hidden Factor: Caching vs First-Time Visitors
Another layer that often gets overlooked is caching.
When you revisit your own site, your browser already has:
- Images stored locally
- CSS and JavaScript cached
- Fonts preloaded
That’s why repeat visits feel almost instant.
But for a first-time visitor:
- Every resource must be downloaded
- Every script must be executed from scratch
- Every dependency adds to the load time
This “cold start” experience is what matters most for perception—and it’s what performance tools try to simulate.
Interaction to Next Paint (INP) Is Now the Priority
A page can look fully loaded and still feel slow.
You see content, images, and layout almost instantly—but when you tap a button or open a menu, there’s a delay. That happens because the browser is still busy processing scripts in the background, so the page isn’t truly ready to respond.
This is the gap between:
- Visual loading – content is visible
- Functional readiness – the page actually responds to input
In 2026, Google cares far more about that second part.
A page can load quickly but still feel slow if:
- Buttons don’t respond immediately
- Menus lag when opened
- Inputs take time to register
On the other hand, a slightly heavier page can feel fast if:
- Interactions are instant
- Feedback is immediate
- The interface stays stable
That’s exactly what INP (Interaction to Next Paint) measures. It focuses on how quickly your site reacts after a user does something.
So optimizing only for load time isn’t enough anymore. If your page doesn’t respond instantly, it will still be seen as slow—even if it looks fast at first glance.
Practical Fixes That Actually Move the Needle
Instead of trying to fix everything at once, it’s more effective to focus on areas that directly impact user experience.
For better loading (LCP):
- Optimize your main hero image using modern formats
- Avoid unnecessarily large above-the-fold elements
- Improve server response time
For better responsiveness (INP):
- Reduce heavy JavaScript execution
- Defer non-essential scripts
- Limit third-party tools where possible
For better stability (CLS):
- Always define width and height for images
- Reserve space for ads and embeds
- Avoid inserting content above existing elements
For first-time visitors:
- Use a CDN to reduce latency
- Minimize render-blocking resources
- Keep initial payloads lightweight
These changes directly influence how users experience your site, which is ultimately what matters.
Why Data Might Be Missing (And What It Means)
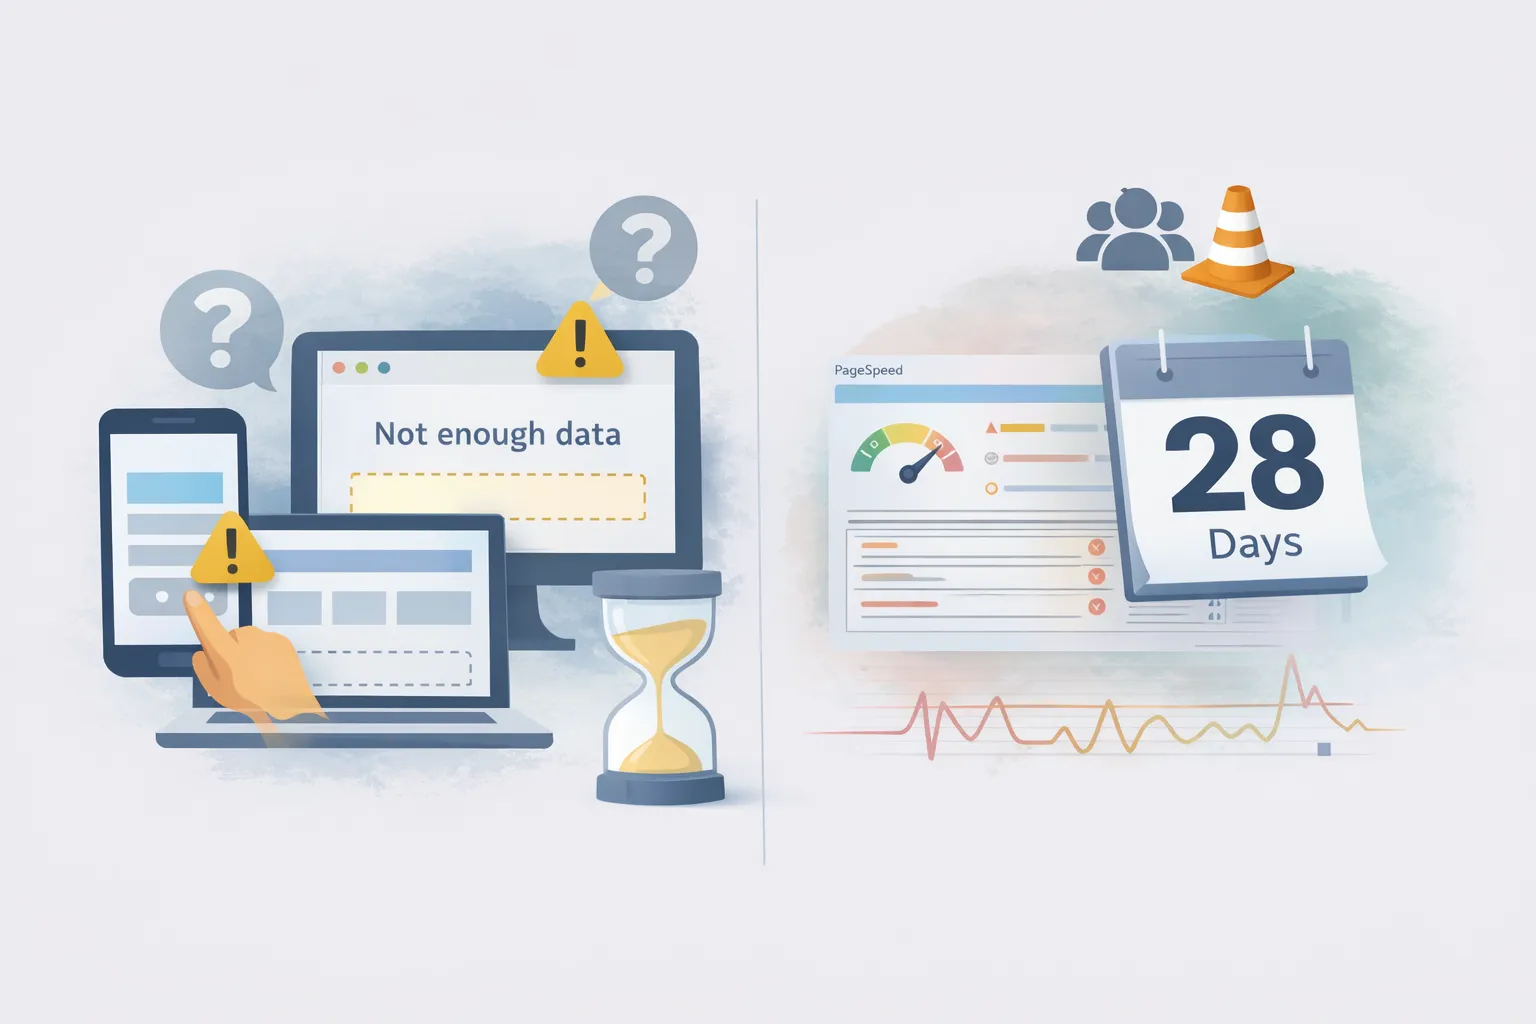
Sometimes you’ll open reports and see messages like the following:
- “Not enough data”
- Empty performance sections
This usually means:
- Your site doesn’t yet have enough traffic
- Or the data hasn’t accumulated over the required time window
Since performance insights rely on aggregated real-world data over a 28-day period, newer or low-traffic pages simply won’t show detailed metrics yet.
In those cases, the PageSpeed report becomes a helpful guide for identifying potential issues—but it shouldn’t be treated as a final judgement.
Final Perspective: What Google Really Wants
When you strip away all the terminology, metrics, and tools, the goal becomes very clear.
Google wants users to:
- Find what they’re looking for without friction
- See meaningful content quickly
- Interact with the page without delay
- Avoid unexpected layout shifts or instability
If your site delivers on those fundamentals, you are aligned with how ranking works—regardless of whether your score is 65 or 95.
Summary: How to Optimize Without Losing Your Mind
If you want a grounded approach that actually works, focus on this:
- Treat the 0–100 score as a diagnostic tool, not a goal
- Aim to pass Core Web Vitals rather than chasing perfection
- Prioritize interaction speed, not just load time
- Think in terms of real users, not ideal conditions
- Improve site-wide performance, not just individual pages
And most importantly:
If your site feels fast to real users, you’re already ahead—regardless of what the score says.